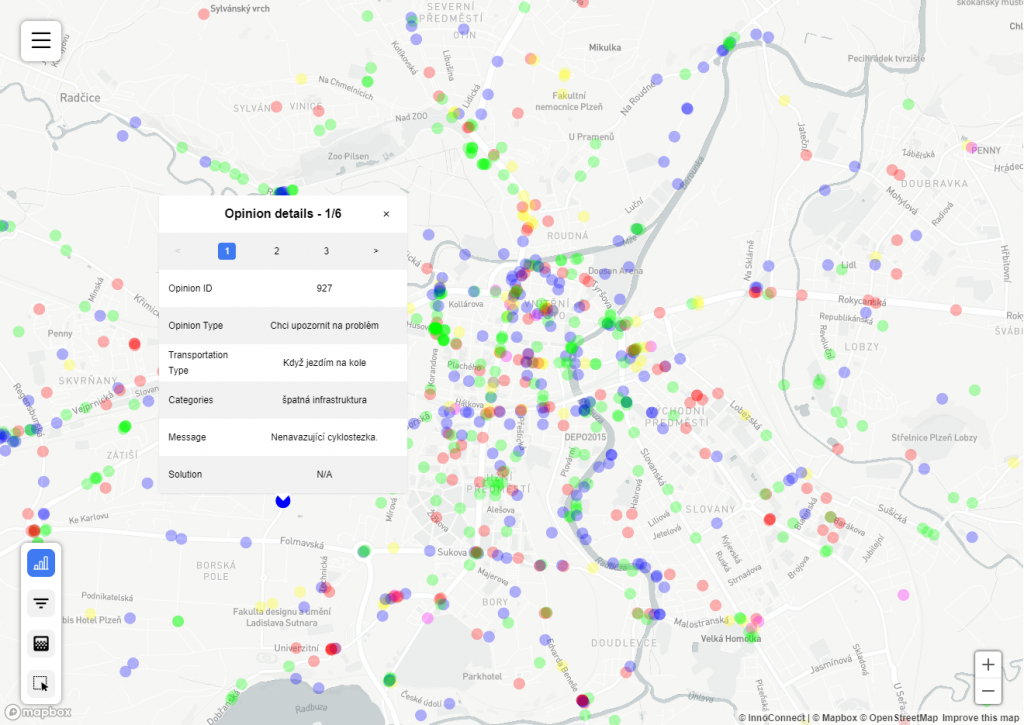
PointInfoMap layers are used to show details about point-based maps. Each Data point is represented as a clickable dot, and a popup with configurable detailed information is shown after clicking the dot. If multiple points overlap, all points under the clicked coordinates can be seen in the popup.
In addition to Common layer settings, the PointInfoMap layer type has the following settings:
- Min zoom:
The minimal zoom level at which points will be displayed – between 0 (farthest) and 22 (closest). This means that if Min zoom is set to 10, no points will be displayed at zoom level 9 or less. Note that points might still not be visible even at the allowed zoom level if there are too many points in the selection. For details about zoom level, see Mapbox Zoom Level. - Popup:
The array of values and their labels shown in the popup. Values can be a combination of any JS functions and the point’s properties, which can be accessed using the $property$ syntax, e.g., usingMath.round($count$)will show the value of a property called count, rounded by JavaScript Math.round function. - Popup HTML:
When used, it replaces the default popup. It allows the usage of the<iframe>tag to show content hosted on an external server. Properties can be accessed through the $property$ syntax, e.g., using$id$will show the value of a property called id. The $property$ syntax can be combined with the<iframe>tag, e.g.,<iframe src="server.xyz/yourform?id=$segment_id$"> </iframe>. - Primary key:
When entered, will load the point details synchronously when opening the popup – can be used to load data points with large (e.g., long text) properties. - Properties:
Properties (database columns) of the data point to load. They can then be used in the popup as described above.
PointInfo layers use Mapbox circle layer style and can use appropriate paint and layout properties.