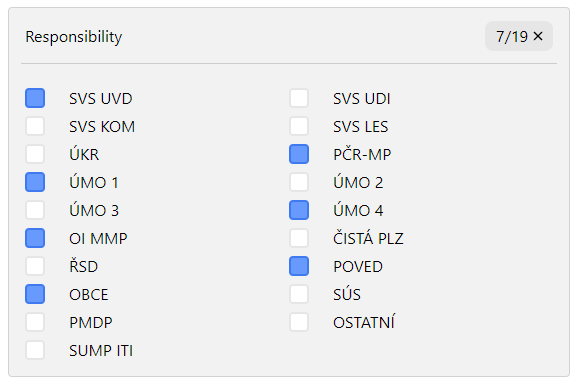
This chart type is used to filter boolean CheckBoxField data using one or more checkboxes.
In addition to Common chart settings, the CheckBoxChart type has the following settings:
- Field IDs:
An array of field IDs to show as checkboxes. All of the fields should have the same group setting for proper functionality.