Linear Field is a type of field for numeric values. Linear field has these subtypes:
- Float
- Integer
- Date
Usage example
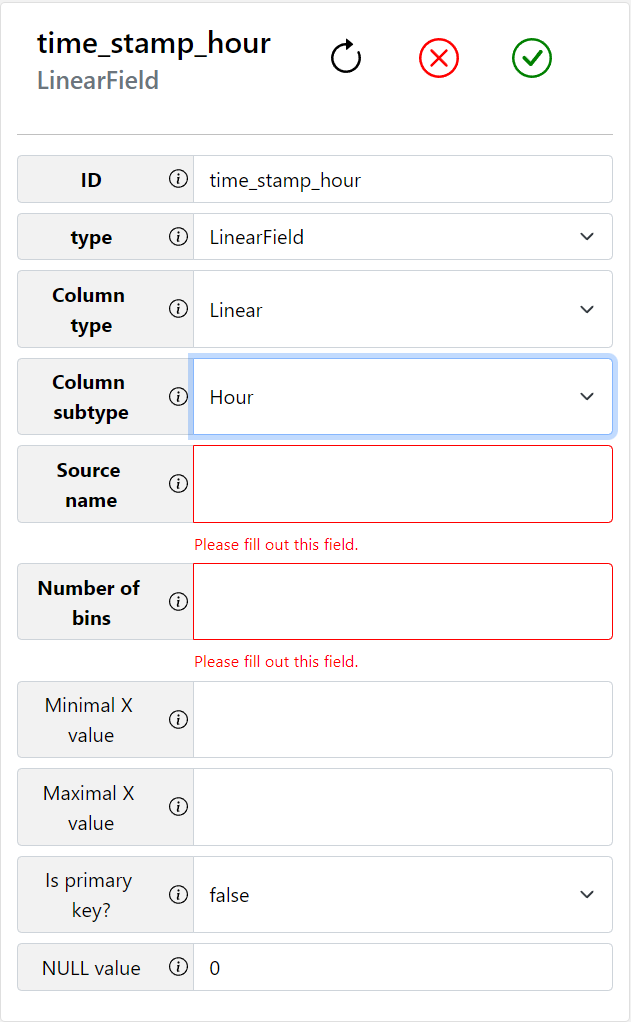
Starting with settings used for days and other time-related data, see in the example below how to set the field for hour-related data:
- In the Fields tab in the Project settings, click on the + button, select LinearField from the dropdown menu and fill in the ID, e.g., time_stamp_hour, and select Hour from the Column subtype dropdown menu.
- Next, fill in the Source name of the column under which the data is stored in the Source Table and fill in 24 in the Number of bins, which refers to the 24-hour day cycle. (For displaying data by days, the Number of bins is 7).
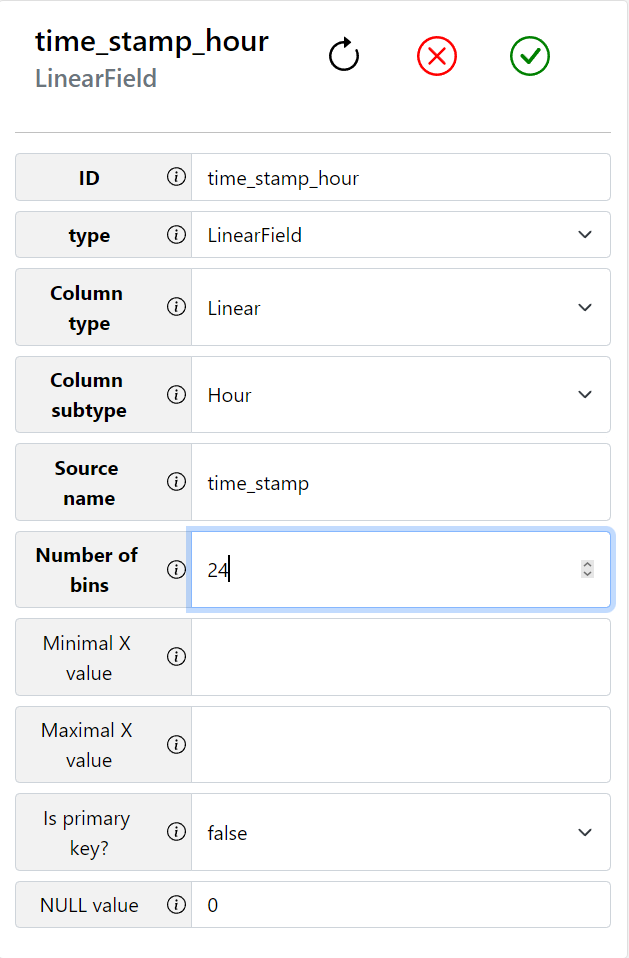
- The final step is to click on the green checkmark button to save your settings.
The other option of using LinearField is the possibility to display data in time intervals if there is an attribute of the year for each row in our Source Table. For example, take a look at the 5-year interval to display data between the years 1990 – 2025 below.
- In the Fields tab in the Project settings click on the + button, select LinearField from the dropdown menu, fill in the ID, e.g., time_stamp_5years, and select Int from the Column subtype dropdown menu.
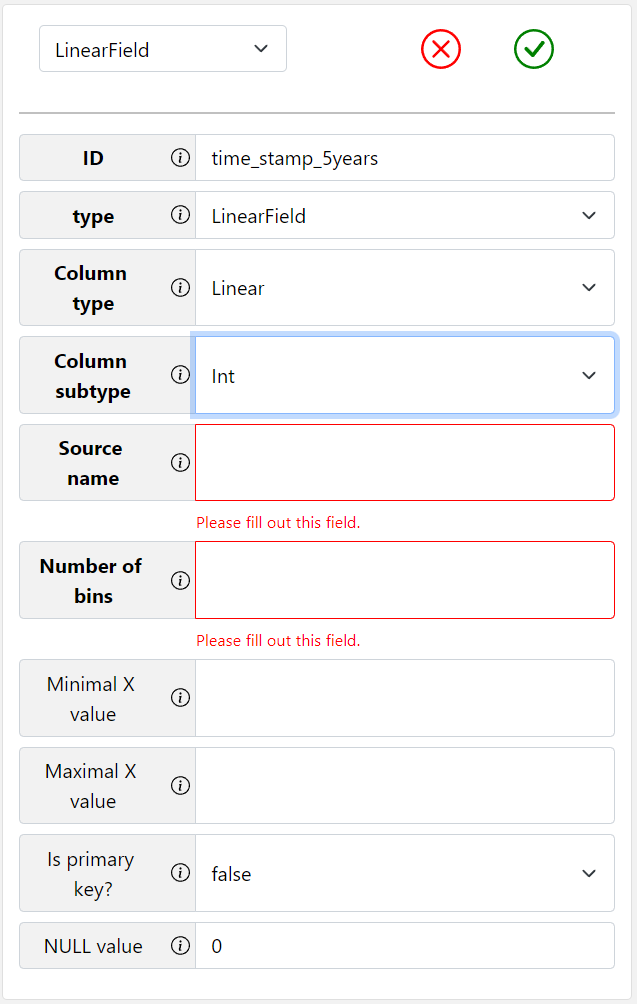
- As a second step, fill in the Source name of the column under which the data is stored in the Source Table and fill in 7 in the Number of bins.
- As a third step, set the Minimal X value to 1990, which is the starting year of the interval. Then set the Maximal X value to 2025, which is the last year of the interval.
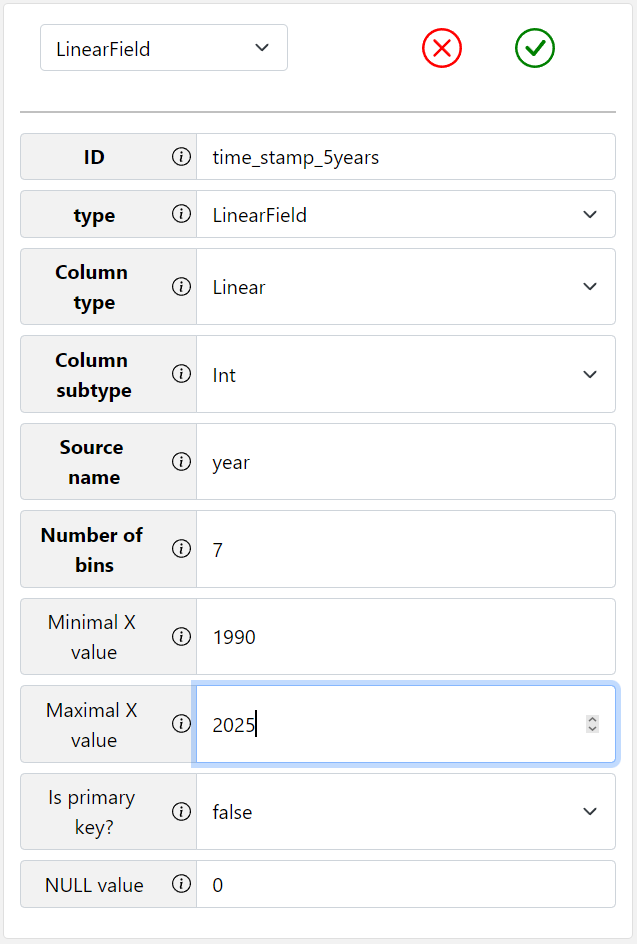
- As for the fourth step, click on the green checkmark button to save the settings.
Hour chart visualization here (in progress)
Interval year chart visualization here (in progress)