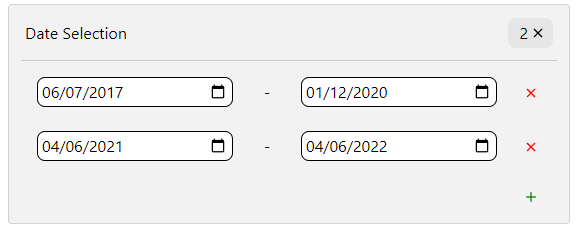
This chart type is used for precise filtering of LinearField data using one or more intervals. Filtering is done by pairs of inputs (one for the start value of the interval, one for the end value).
In addition to Common chart settings, the IntervalChart type has the following settings:
- Field ID:
The ID of the field to filter. Depending on the field subtype setting, the inputs will behave as regular number inputs (subtype Int or Float), date inputs (subtype Date), or time inputs (subtype Hour).