Handling traffic is one of the biggest nightmares for cities. Every little decision can backfire into a major snowball effect, so authorities need accurate data and prediction tools to make sure they make the right decision. Analytical map provides just the tools.
It’s never easy to let go of your old ways. This applies to almost everything: from the first time your grandparents used a smartphone, to the reaction of public administrations when they first heard of Big Data.
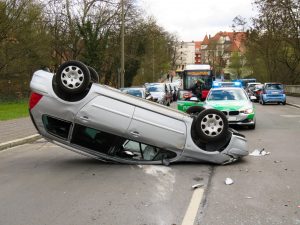
Let’s take a concrete example: car accidents. Traditionally, policymakers would receive complaints from residents or civil society, and then investigate. With Big Data however, they have an opportunity to access interactive maps using police data to provide a dynamic overview of road accidents across the city. Here lies the difference between slow, out-of-touch policymaking and timely and effective decisions.
“Many decision makers are still rooted in the traditional way of doing things. They make policy decisions based on static models of consultation and closed planning meetings over the time frame of a year or more. Their action is often siloed and slow, providing outdated solutions by the time it is ready to be implemented,” says Lieven Raes, coordinator of PoliVisu (Policy Development based on Advanced Geospatial Data Analytics and Visualisation).
Analytical accident maps developed by InnoConnect (within the EU project PoliVisu) aim to challenge these old ways by improving data literacy and providing access to advanced technology. Its policy visualisation tools rely on interactive maps to display data and enable exploration down to the tiniest detail.
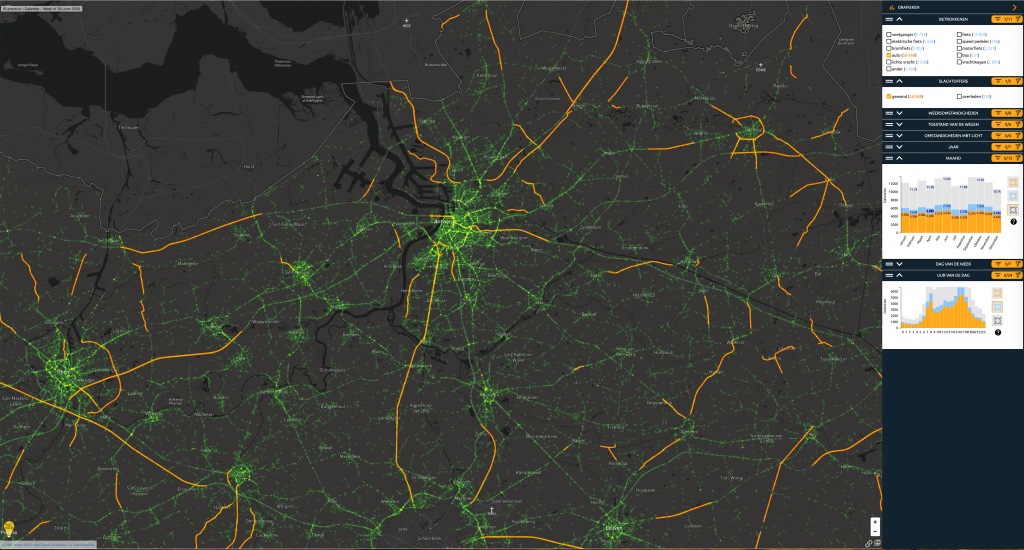
The project specifically focused on transport and mobility. As Raes notes: “It’s an area with lots of potential datasets to use. Mobility forms the backbone of any city, and it’s a great topic to experiment with in locations of different sizes and with different states of advancement with regards to the use of Big Data.”