Solutions
We’re especially strong in visual analytics of big geospatial data. Look at several examples of solutions built with our products, ranging from smart mobility to criminality prevention, visualisation of statistical data, and geomarketing maps. Any spatio-temporal data (i.e. related to space and time) can be used with our analytical maps. More complex your data is, more you will benefit from the powerful filtering functionalities. Do not hesitate to contact us with your needs!
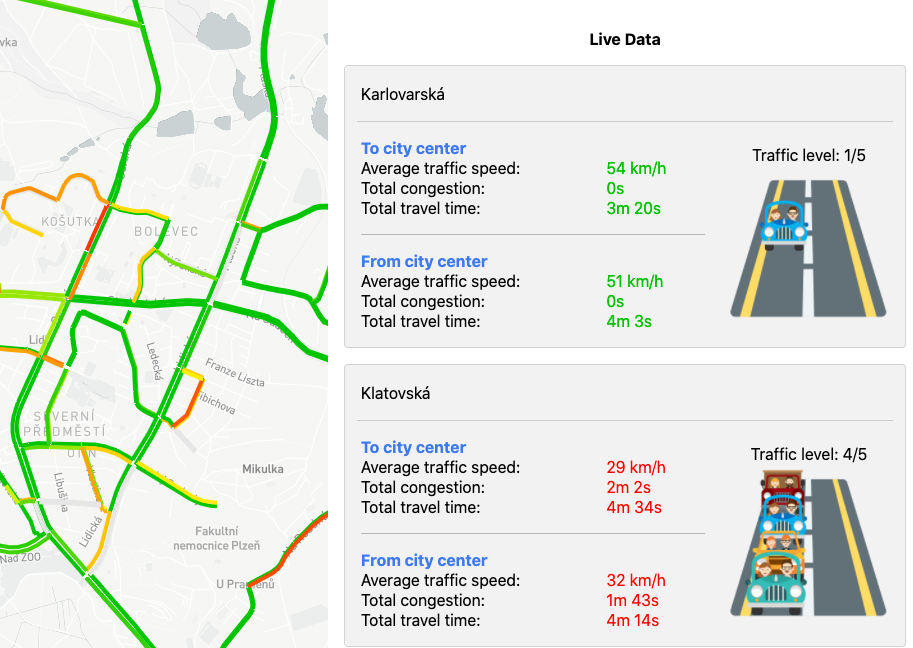
Mobility Dashboards
Real-time dashboards combined with powerful historical data analytics in one place.
Explore interesting maps, charts and figures related to mobility in your city. Combine different types of analytical maps in a single dashboard that will not only inform your citizens on their daily mobility choices but will also support your policy makers and mobility experts in their decision making.
Features
- View real-time traffic dashboards including the current speed of traffic
- Analyse historical data for any period of time based on your choice
- Various types of charts and maps
- Configuration interface to set up own maps and charts yourself
- All mobilty maps in one place
- Real-time dashboards
- Historical data analysis
- Built with GLayer

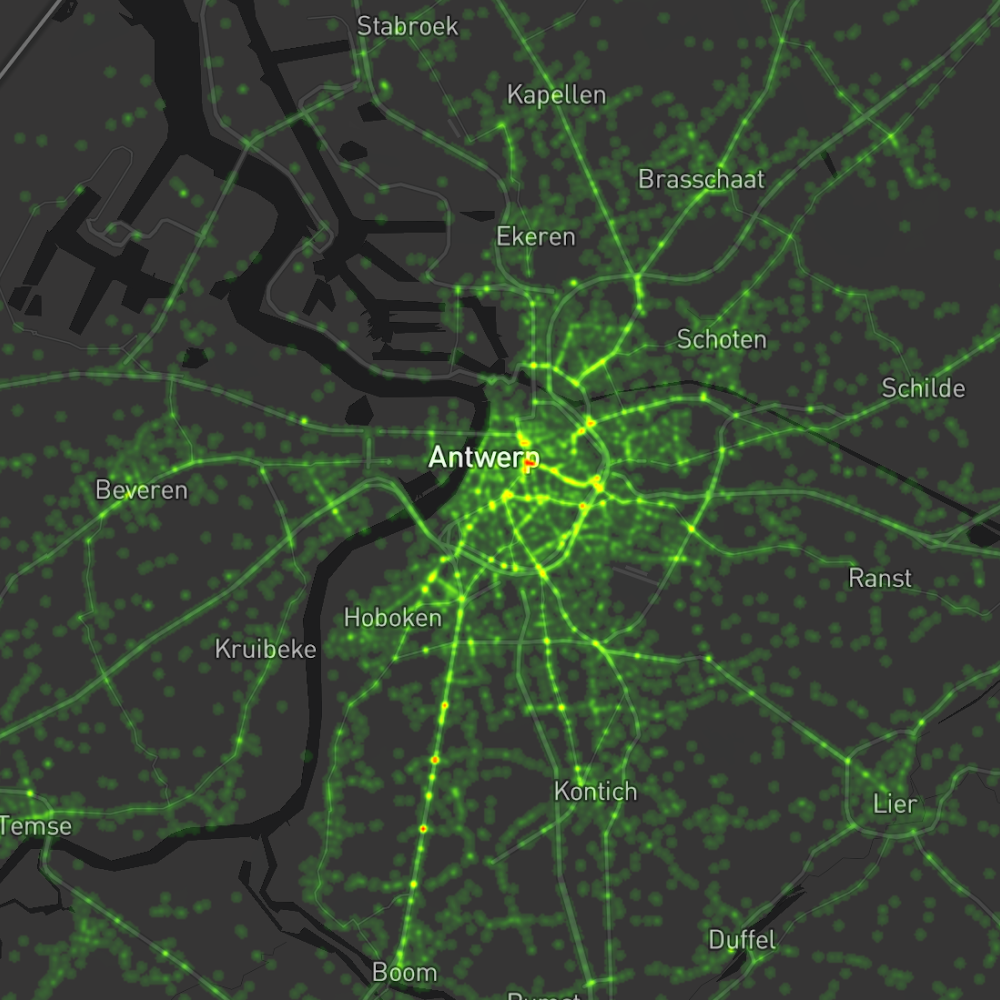
Traffic Intensity Maps
Use the interactive map and charts to analyse traffic on road segments.
Discover new ways to draw data-driven insights for strategic and operational decision making in traffic management. Base your decisions on accurate information rather than assumptions.
For instance, check the current traffic intensity detected by the ANPR cameras on the road segments in your region. Or use the powerful data-processing engine behind the map to visualise historical traffic on any segment at any hour of the day, for the time period of your choice. Filter historical traffic data for specific days and hours by clicking in the calendar and in the charts.
Features
- View real-time traffic intensity on the map
- View historical traffic intensity data on the map that is linked with the charts
- Charts display data for the current map view or for selected road segments
- Selection of a road segment (or multiple) from the map
- Selection of specific date (or multiple) in the calendar
- Selection of day(s) and hour(s) in the charts
Traffic Accidents Maps
Perform a deep analysis of traffic safety to get detailed knowledge of high-risk locations and specific accident information.
Road safety is a major concern worldwide. With the Traffic Accidents Map, decision makers at different levels of governance can gain data driven insights to better design, implement and evaluate measures aimed at reducing road accidents. For instance, law enforcement agencies use the tool as a monitoring system to improve daily operations or the quality of Police reports.
The application can be configured for any city, police zone, region or country, subject to data availability. In Belgium, data is provided by the Federal Police, covers accidents since 2014 and is updated regularly. We’ve also developed accident maps in the Czech Republic and in the UK.
Features
- Filter accidents by year, month, day and even hour using the interactive barcharts
- Get contextual information on accident involvement (car, pedestrian, cyclist, electric bicycle, truck etc.), consequences (injured, deceased), weather and road conditions etc.
- Zoom in on the area of interest via custom (polygon) selection
- Add more data layers (schools, communities, regions, average speed control zones) for a deeper contextual analysis
- Automated data updates
- Data from official police statistics
- Built with GLayer
- Automated data updates
- Statistical data analysis per territorial unit
- Built with WebGLayer Pro
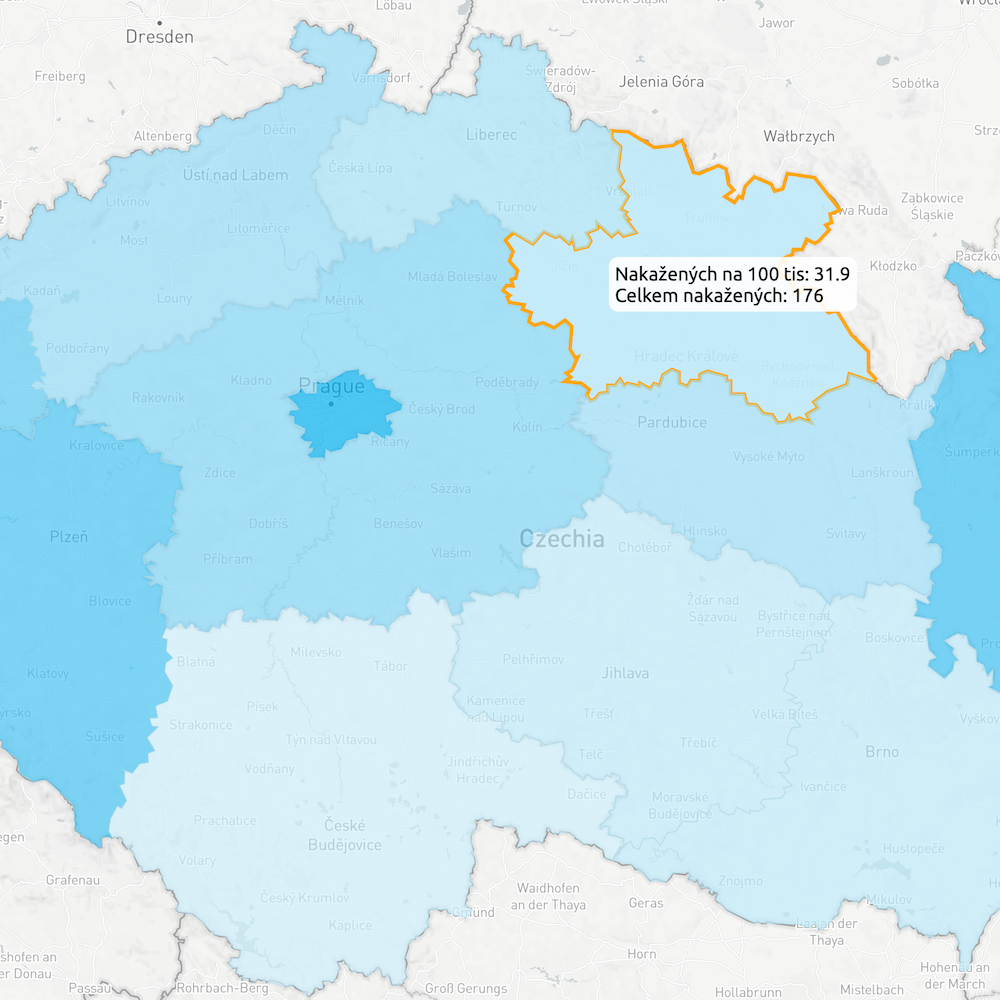
Statistics Maps
Make statistics data easy for everyone on an interactive map. Any kind of statistical data that is spatially referenced is a perfect match for the Statistics Map.
Analyse the statistical data by clicking in the barcharts and by selecting regions directly on the map. Different combination of filters can be applied for deeper insights, for instance by selecting a certain age group, sex, region or country.
Features
- Analyse statistical data on the map and through charts
- Select multiple regions
- Charts display data for the full map view or for selected regions
- Filter per time period
- Filter per age group, sex, region, population size etc.
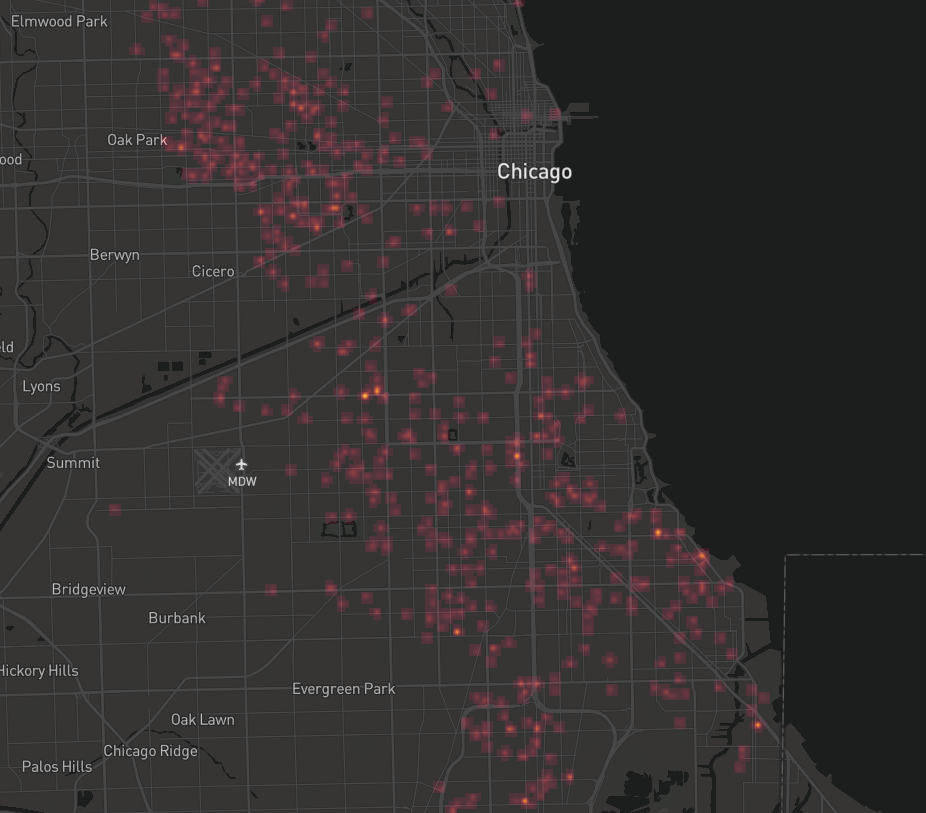
Criminality Maps
Dive deep in the historical criminality data. Learn about high-risk areas to prevent criminality.
With the Criminality Map, decision makers can obtain reliable data evidence to better design, implement and evaluate criminality prevention measures. Police can use the tool as a monitoring system to improve daily operations.
The application can be configured for any city, region or country, depending on available (open) data.
Features
- Filter crimes by year, month, day and even hour using the interactive barcharts
- Get further information about the crime (e.g. type, arrest, district)
- Zoom in on the area of interest via custom (polygon) selection
- Add more data layers (e.g schools, restaurants, playgrounds, tourist sites) for a deeper contextual analysis
- Automated data updates
- Data from official police statistics
- Built with WebGLayer Pro
- Automated data updates
- Floating car data, ANPR camera data, telco data
- Built with GLayer
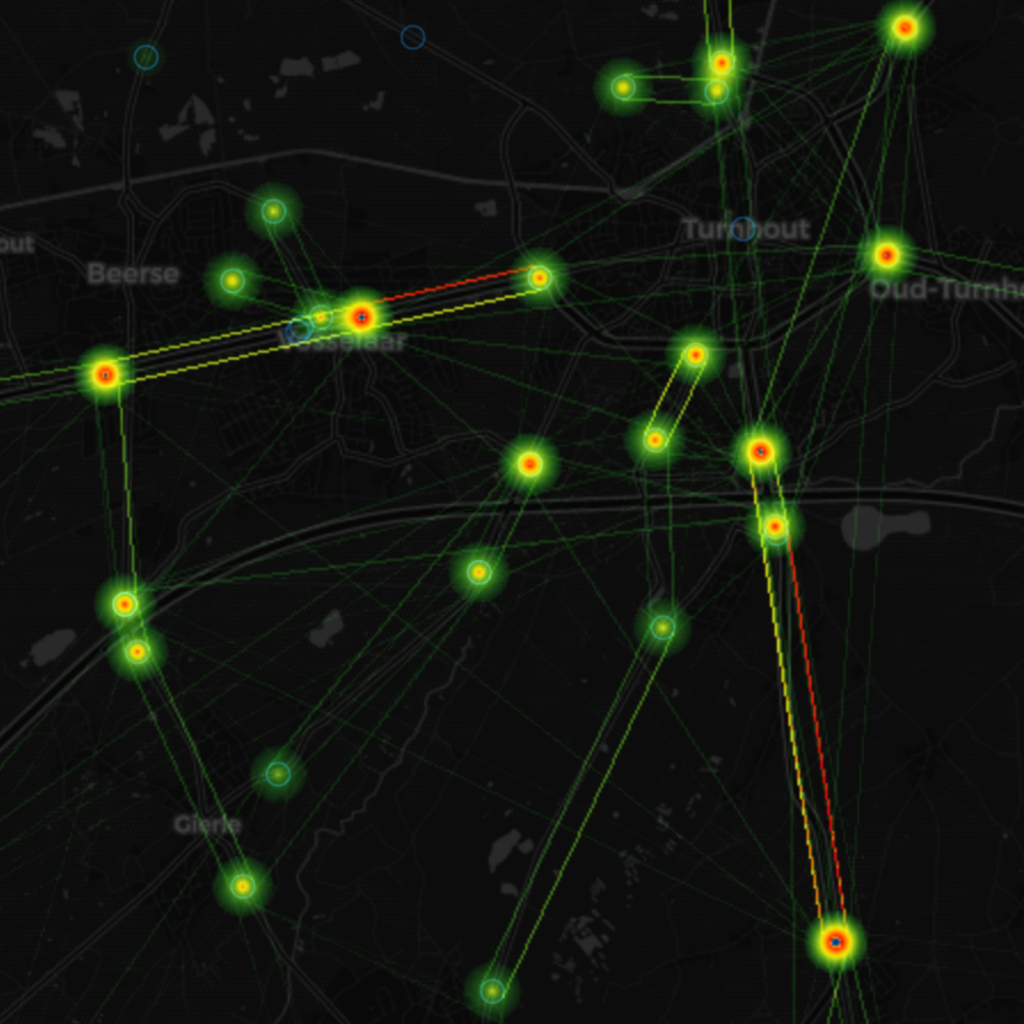
People and traffic flow maps
Use the flow maps to get a complex view on movement of people or objects over space and time in your city or region.
Discover trends in the movement of people or objects to better design policy or adjust daily operations. Analyse the amounts and speed of travellers by clicking in the charts and by selecting locations of arrival or departure directly on the map. Different combination of filters can be applied for deeper insights.
Features
- Analyse amounts and speed of travelling people or moving objects on the map and through charts
- Filter per type of the object
- Filter per location of departure or arrival
- Filter per time period
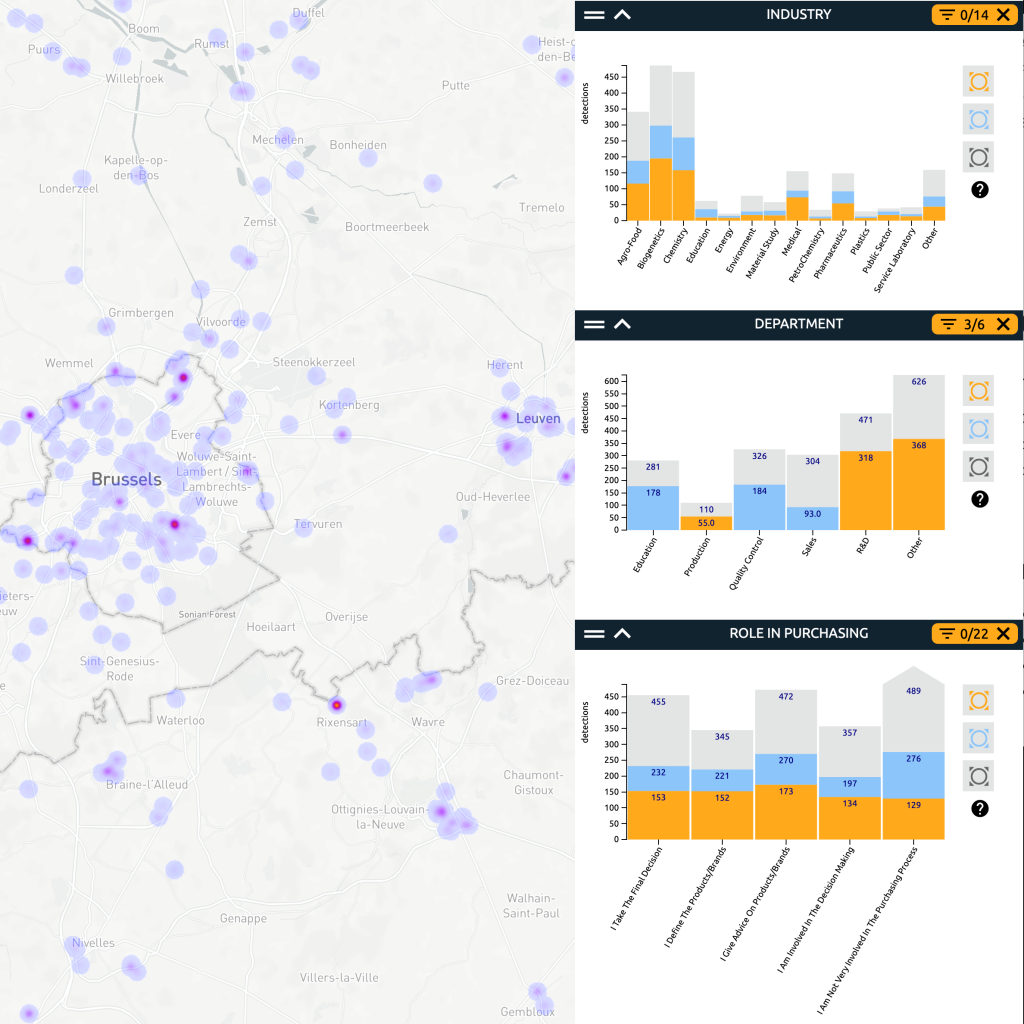
Geomarketing Maps
Learn where your customers are located to better target your marketing activities.
Configure the Geomarketing Map to know the whereabouts of your clients. Filter the map content based on information included in your customers’ database. Apply combinations of multiple filters for deeper insights and tailored marketing offerings.
Features
- Analyse the location and amounts of your clients on the map
- Filter based on all infrormation provided in your data
- Zoom in on the area of interest via custom (polygon) selection
- Add more data layers for a deeper contextual analysis
- Automated data updates
- Connect your customer database
- Built with WebGLayer Pro