Webinar topic:
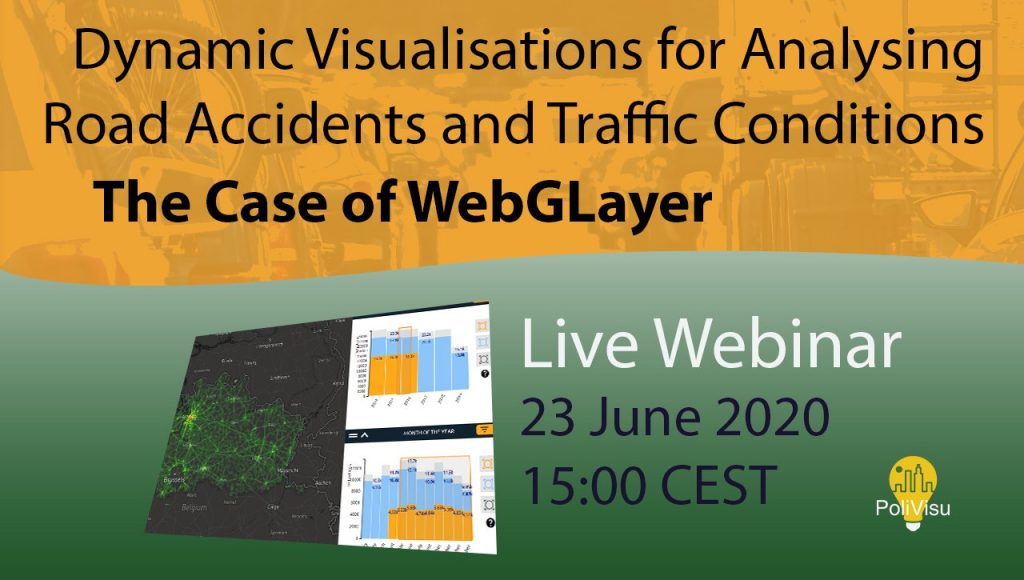
Dynamic Visualisations for Analysing Road Accidents and Traffic Conditions: The Case of WebGLayer

Speakers

Modern data analysis often requires special techniques for handling complex data structures. Interactive graphs can provide insights into multivariate datasets by communicating the key aspects in a more intuitive way than isolated bar charts or static maps.
This webinar will present the WebGLayer tool as an enabler of dynamic visualisations that make spatio-temporal patterns, relationships and trends in the underlying data more apparent. Using case studies from Pilsen (CZ) and Flanders (BE) we’ll show how policy makers can use WebGLayer to address local problems such as traffic congestion and road accidents.
Others who might find this event useful include web developers, Open Source enthusiasts, social scientists, journalists and civil society groups interested in exploring social issues through data visualisations.
Why should I attend?
- Learn about the benefits of dynamic visualisations
- Discover best practice examples from European cities and regions
- Find out how WebGLayer can support transport decision making
- Get a sneak peek at other PoliVisu tools and services