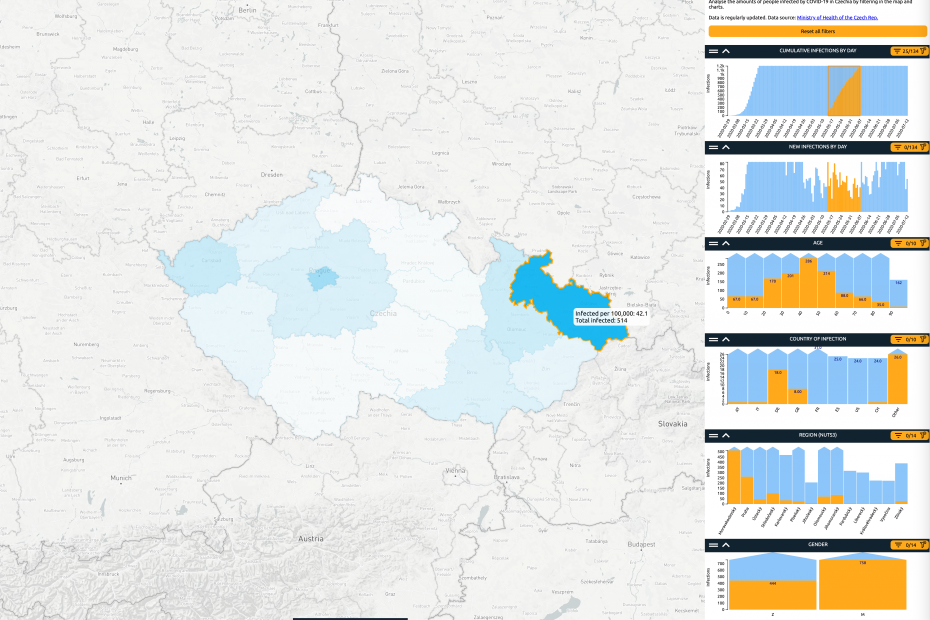
InnoConnect’s Covid-19 Map published on the EU Open Data portal
Our interactive Map of COVID-19 spread in Czechia has just been officially published on the EU’s Open Data Portal as an application that demonstrates the potential of EU’s open data. Visit the EU Open Data Portal About the app: This interactive app tracks the spread of COVID-19 in Czechia. You… Read More »InnoConnect’s Covid-19 Map published on the EU Open Data portal